- Laptops
- Gaming Laptops
- XMG APEX
- XMG CORE
- XMG FOCUS
- XMG FUSION
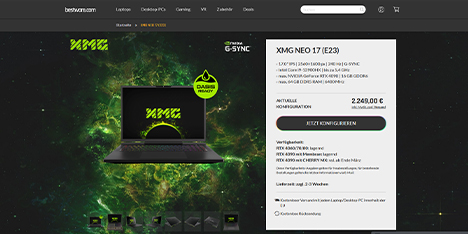
- XMG NEO
- XMG PRO
- Ultrabooks
- XMG EVO
- Accessories
- Watercooling
Gaming LaptopsXMG APEX- Models
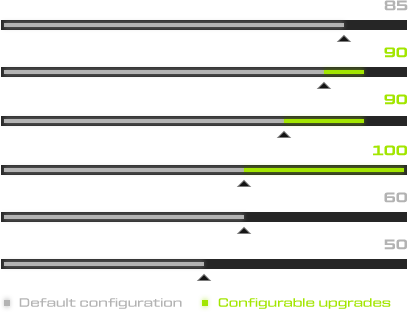
- XMG APEX 16 MAX
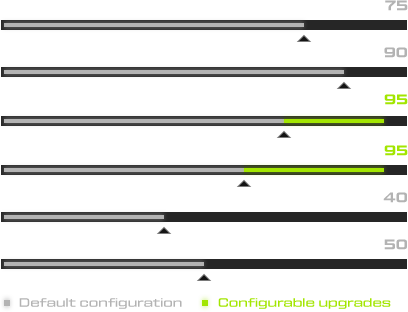
- XMG APEX 17
Models
 XMG APEX 16 MAX
 XMG APEX 17
 XMG CORE
- Model
- XMG CORE 15
- XMG CORE 16
- XMG CORE 16 VE
Model
 XMG CORE 15
 XMG CORE 16
 XMG CORE 16 VE
 XMG FOCUS
- Models
- XMG FOCUS 17
Models
 XMG FOCUS 17
 XMG FUSION
- Models
- XMG FUSION 15
- XMG FUSION 16
Models
 XMG FUSION 15
 XMG FUSION 16
 XMG NEO
- Models
- XMG NEO 16 (E25)
- XMG NEO 16 (A25)
- Accessories
- XMG OASIS
Models
 XMG NEO 16 (E25)
 XMG NEO 16 (A25)
 Accessories
 XMG OASIS
XMG PRO
XMG OASIS
XMG PRO- Models
- XMG PRO 16
- XMG PRO 16 VE
Models
 XMG PRO 16
 XMG PRO 16 VE
 Ultrabooks
- Modell
- XMG EVO 14
- XMG EVO 15
Modell
 XMG EVO 14
 XMG EVO 15
 XMG EVO
- Modell
- XMG EVO 14
- XMG EVO 15
Modell
XMG EVO 14
XMG EVO 15
AccessoriesWatercooling- Model
- XMG OASIS
Model
XMG OASIS
- Desktop PCs
- Gaming PCs
- XMG NOMAD
- XMG SECTOR
- XMG TRINITY
- Audio PCs
- XMG STUDIO
- Powered by iCUE
- XMG UNIFY Series
Gaming PCsXMG NOMAD- Models
- XMG NOMAD
Models

 XMG NOMAD
 XMG SECTOR
- Models
- XMG SECTOR E
- XMG SECTOR
- XMG SECTOR X
Models
XMG SECTOR E
 XMG SECTOR
 XMG SECTOR X
 XMG TRINITY
- Models
- XMG TRINITY
- XMG TRINITY X
Models
 XMG TRINITY
 XMG TRINITY X
 Audio PCsXMG STUDIO
- Models
- XMG STUDIO
- XMG STUDIO X
ModelsContent
XMG STUDIO
 XMG STUDIO X
 Powered by iCUEXMG UNIFY Series
- Models
- XMG UNIFY C1
- XMG UNIFY C2
- XMG UNIFY C3
Models
 XMG UNIFY C1
 XMG UNIFY C2
 XMG UNIFY C3
- Community

REDDIT 
DISCORD
- Our DNA
15 YEARS OF XMG 
WE LOVE GAMING 
YOUR FPS DELIVERY SERVICE 
MADE TO CREATE 
E-SPORTS
- News & Reviews
XMG NEO 16 
XMG PRO 16 (M25) 
XMG EVO 2025 
XMG CORE & XMG FUSION 
"The most POWERFUL laptop..." 
"...is a GAMECHANGER..."
- Goodies

COMING SOON... 
SALTY SINCE 09 
DOGGIE 
DUNES
- Shops
- Support

DRIVERS & UPDATES 
FAQ & SUPPORTINQUIRY 
DISCORD & CO